



ORGANIZATIONAL INFRASTRUCTURE & PROGRAM MANAGEMENT
Blind Wiring: The Brutal Cost of Undocumented Infrastructure
Every unlabeled port, every undocumented server, and every hoarded spreadsheet is a tax on your next project. Here’s what it’s actually costing you — and the two moves that stop the bleeding.
PROGRAM & PORTFOLIO MANAGEMENT · IT OPERATIONS · PMO · 12 MIN READ

THE MISSING LINK: WHAT HAPPENS FROM “PORT” TO “BUSINESS IMPACT” WHEN NO ONE WROTE IT DOWN
Ask any project manager to name the exact business application that goes dark if a single switch port is disconnected — and watch the room go quiet.
That silence isn’t a knowledge gap. It’s a structural failure, repeated in nearly every mid-to-large enterprise, and it is quietly one of the most expensive problems in corporate IT and program management today. Not because the technology is hard. Because nobody wrote it down — and everyone assumed someone else did.
This article is about that gap: what it costs, who is responsible for it, and the two moves — one operational, one cultural — that close it for good.
FIELD NOTES — 20 YEARS ACROSS 25+ ORGANIZATIONS
[ Global Banking ] [ Financial Services ] [ Insurance ] [ Semiconductor ] [ Shipping & Logistics ] [ Cosmetics ] [ Manufacturing ] [ IT Services ] [ Contact Centers ] [ Government ]
Over more than two decades in the IT industry, spanning 25+ organizations across global banking, financial services, insurance, semiconductors, shipping and logistics, cosmetics, manufacturing, IT services, contact centers, and government, one issue has surfaced with striking consistency: the absence of proper information mapping and organization.
This is rarely the result of a single cause. It typically stems from a combination of factors — chronic understaffing, reluctance to document work, a desire to preserve individual indispensability, job insecurity, the deliberate use of information as leverage, management’s failure to recognize information mapping as a core organizational function, and an over-reliance on vendors to reconstruct this knowledge from scratch when it’s needed most.
The consequences compound quickly, giving rise to a predictable set of problems — and a corresponding set of solutions — which this article explores in detail.
PROBLEM 01
The Missing Map: Port-to-Application Blindness
In theory, every organization has a current, accurate map of which network port connects to which switch, which server sits behind it, which database that server feeds, and which business application ultimately depends on it. In practice, that map rarely exists in one place — and when it does, it’s usually two years out of date.
The result is that a routine question — “what breaks if we touch this?” — turns into a multi-day investigation involving three teams, a war-room call, and someone’s memory of a decommissioning that “probably” happened in 2022. Multiply that by every change request, every migration, and every incident, and you have an organization that is permanently reverse-engineering itself.
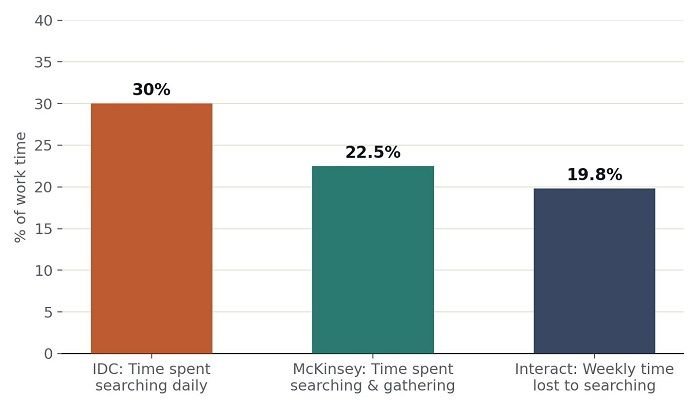
Where Knowledge Workers’ Time Actually Goes
Source: IDC, “The High Cost of Not Finding Information” · McKinsey Global Institute, The Social Economy
PROBLEM 02 & 03
Nobody Documents, and Nobody Talks Across the Fence
The port-mapping problem is really a symptom of two deeper habits. First, documentation is treated as optional overhead — something to do “after the project,” which means it’s done never. Engineers move fast, tickets close, and the tribal knowledge stays exactly that: tribal, living in one person’s head or one person’s laptop.
Second, and more corrosive, is silo culture. Network teams, application teams, database teams, and infrastructure vendors each maintain their own fragments of the truth, in their own tools, with no shared source of record. Nobody owns the seam between silos — so the seam simply doesn’t exist. When a project needs information that spans two silos, it needs a negotiation, not a lookup.
| NETWORK TEAM
“We know our switches. What runs on top of them isn’t our problem.” |
APPLICATION TEAM
“We don’t touch infrastructure. Ask the network guys which port we’re on.” |
Both statements are true. Both teams are, individually, doing their jobs. And together, they leave a hole exactly where the project manager needs a floor to stand on.
PROBLEM 04
Every Project Pays the “Discovery Tax”
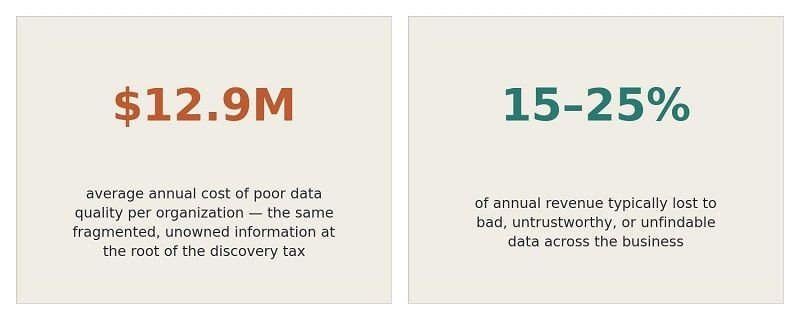
This is where the damage compounds. Because nothing is mapped centrally, every single project — regardless of size — must first re-discover what already exists before it can plan what changes. A firewall upgrade needs a week of “impact assessment” that is really just archaeology. A server decommission needs sign-off from six teams because no one can say with confidence what else is riding on it. A “two-day” cutover becomes a two-week ordeal because half of it is spent finding out what the cutover will actually touch.
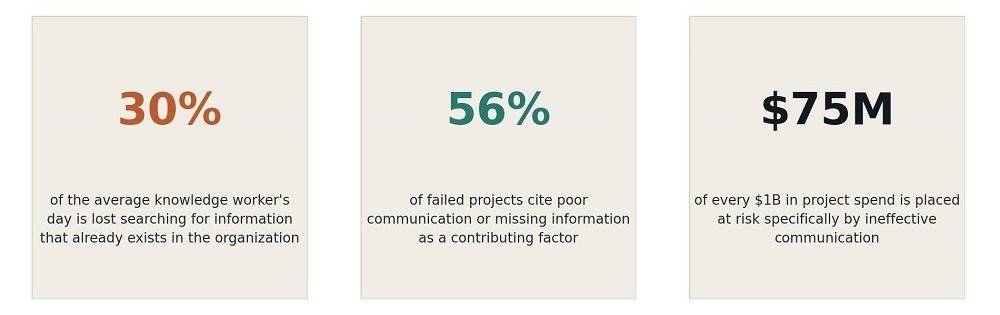
Industry research on project failure backs this up almost exactly: communication and information breakdowns are consistently the single largest driver of projects that miss their goals, timeline, or budget.
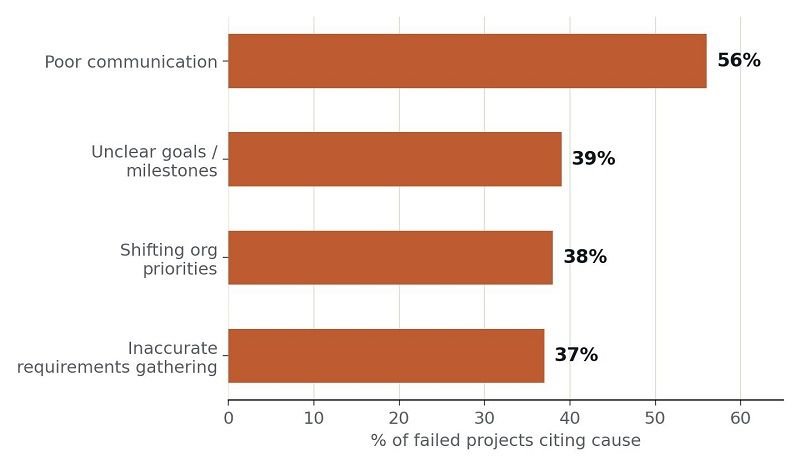
Primary Contributors to Project Failure
Source: PMI, Pulse of the Profession® · Apollo Technical, Project Management Statistics 2026
Notice that “poor communication” and “unclear/undocumented requirements” together account for the majority of failure causes — and both are direct downstream effects of the same root problem: information that exists somewhere, but not where the project needs it, when it needs it.
The discovery tax bites hardest not during planned work, but during live incidents — when every minute spent figuring out what this actually connects to is a minute the business is exposed and losing money in real time. Gartner’s long-standing downtime benchmark puts the average cost of unplanned IT downtime at
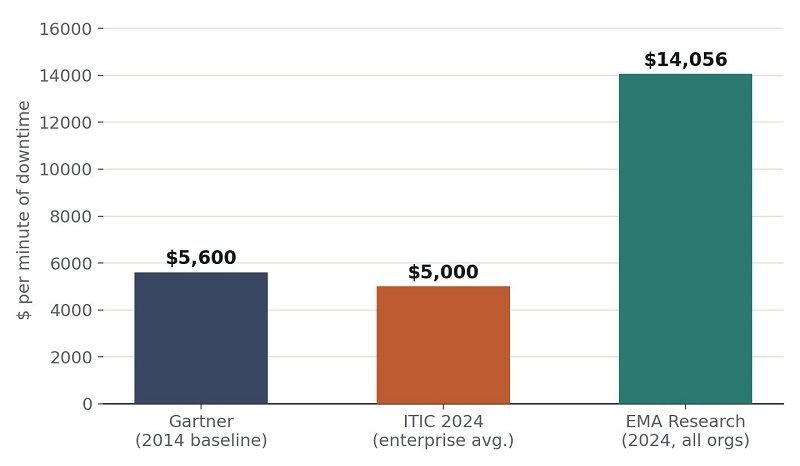
Cost of Unplanned Downtime, Per Minute — Every Minute Spent “Discovering” Counts
Source: Gartner (2014 baseline) · ITIC, 2024 Hourly Cost of Downtime Survey · EMA Research, 2024 Downtime Cost Analysis
PROBLEM 05
The Project Manager Is Left to Beg
Nobody absorbs this dysfunction more directly than the project manager. The PM does not own the network. The PM does not own the application. The PM owns the outcome — and that means chasing down five different owners, in five different tools, to answer one question that should take thirty seconds.
Worse, the PM often meets outright resistance. Teams that are overloaded, territorial, or simply indifferent to a project that “isn’t theirs” will deprioritize the request, answer vaguely, or not answer at all. The PM has accountability without authority — and a dependency map with more gaps than lines.
| THE FRUSTRATION, STATED PLAINLY
“I can’t plan what I can’t see.” A PM working from an accurate, current dependency map can sequence work with confidence, quote realistic timelines, and flag risk before it becomes an incident. A PM working blind spends the first third of every project just building the map that should have already existed — and still gets blamed when the resulting date slips. Organized information doesn’t just make a PM’s life easier; it is the single highest-leverage input into faster, more predictable execution. A team with a living, trustworthy system of record plans in days what a siloed team discovers in weeks. |
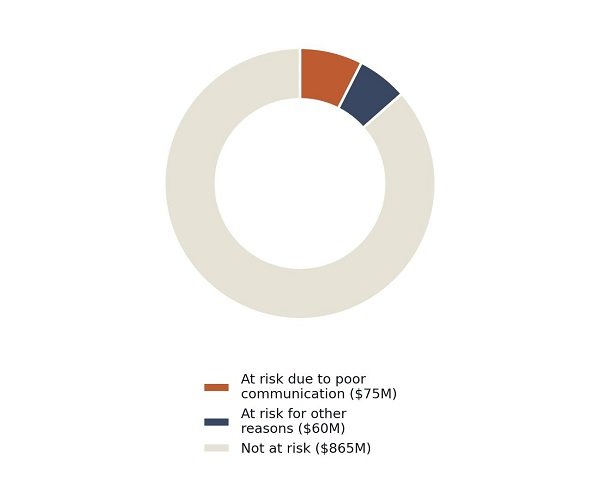
| WHAT THIS LOOKS LIKE IN PRACTICE
Escalate the blocker, not just the deadline. When a project stalls because information wasn’t shared, that fact belongs in the status report — by name, by team, by date requested. Steering committees and leadership meetings should treat “we don’t have information X because team Y hasn’t provided it” as a red flag equal to a budget overrun, not a footnote. Repeated, visible non-response should trigger a direct, documented escalation to the responsible manager — not a quiet workaround. Sunlight is the fastest way to change behavior that thrives in the dark. |
Done consistently, this does two things: it identifies the small number of genuine bad actors — the ones deliberately gatekeeping for leverage or self-preservation — and it resets the norm for everyone else, who were simply following the path of least resistance in a culture that never asked for better.
THE PAYOFF
What Faster Actually Looks Like
The organizations that do both — build the map, and confront the hoarding — don’t just avoid delay. They change the shape of their project timelines entirely. Impact assessments that took weeks take hours. Change approvals move from six-team negotiations to a single lookup. PMs plan against a real dependency graph instead of a best guess, and can commit to dates that actually hold.
The opportunity cost calculation runs in reverse: the same discipline that used to bleed budget and time back into the organization becomes the very thing that lets projects launch on schedule, close windows before competitors do, and rebuild trust between the PMO and the business it serves. Organized information isn’t an IT hygiene project. It is the fastest, cheapest lever most companies aren’t pulling.
| THE BOTTOM LINE
You Cannot Execute Faster Than You Can See Every undocumented port, every silo, every quietly withheld spreadsheet is a decision to pay the discovery tax again on the next project — and the one after that. Trace it once. Document it properly. Say out loud, in the room, who isn’t sharing. That’s the whole fix — and it’s cheaper than what you’re paying for not doing it. |
REFERENCES
Sources
1. Project Management Institute (PMI). Pulse of the Profession® In-Depth Report: The High Cost of Low Performance — The Essential Role of Communications. 2013. pmi.org/learning/library/en-2013-pulse-high-cost-low-performance-13512
2. Project Management Institute (PMI). Pulse of the Profession® — Communication. pmi.org/learning/library/communication-11189
3. Apollo Technical. 51 Project Management Statistics To Know in 2026. apollotechnical.com/51-project-management-statistics-that-every-manager-should-know
4. IDC. The High Cost of Not Finding Information (White Paper).
5. McKinsey Global Institute. The Social Economy: Unlocking Value and Productivity Through Social Technologies.
6. Gartner (Andrew Lerner). The Cost of Downtime. 2014 baseline estimate of $5,600/minute.
7. Information Technology Intelligence Consulting (ITIC). 2024 Hourly Cost of Downtime Report. itic-corp.com/itic-2024-hourly-cost-of-downtime-report
8. EMA Research. 2024 Analysis of Unplanned IT Downtime Costs.
9. Gartner. Magic Quadrant for Data Quality Solutions. Melody Chien & Ankush Jain, 2020. Average annual cost of poor data quality: $12.9M.
10. Redman, Thomas C. Cited in MIT Sloan Management Review / Harvard Business Review. Estimate of 15–25% of revenue lost annually to poor data quality.
pmbasecamp.com/ — PROGRAM & PORTFOLIO MANAGEMENT




No Comment! Be the first one.